
14
UCLABruinsUCLA
1-0, 1-0 Visitante

45
Final
| 1 | 2 | 3 | 4 | T | |
|---|---|---|---|---|---|
| UCLA | 7 | 7 | 14 | 17 | 45 |
| STAN | 0 | 7 | 3 | 7 | 17 |

17

StanfordCardinalSTAN
0-1, 0-1 Casa
Líderes do Jogo
Jds/Passe
7
B. Olson16/29, 286 YDS, 5 TD
9
T.C. Ostrander27/59, 346 YDS, 2 TD
Jds/corrida
36
K. Bell19 TTV, 195 JDS
5
A. Kimble14 TTV, 69 JDS
Jds recebidas
1
B. Breazell6 REC, 111 JDS, 1 TD
9
R. Sherman4 REC, 100 JDS, 1 TD
Estatísticas da Time
Total Yards
- UCLA624
- 398STAN
Turnovers
- UCLA0
- 2STAN
Posse
17:4818:52UCLASTAN1st Downs
- UCLA24
- 21STAN
| Matchup |
|
|
|---|---|---|
| Primeiras descidas | 24 | 21 |
| Eficiência em 3as descidas | 6-16 | 4-18 |
| Eficiência em 4ªs descidas | 0-0 | 0-1 |
| Jardas totais | 624 | 398 |
| Jardas aéreas totais | 296 | 394 |
| Att/comp | 16/29 | 27/59 |
| jds | 9.9 | 5.9 |
| INT | 0 | 0 |
| JDS | 338 | 52 |
| Tentativas de corrida | 50 | 26 |
| média | 6.8 | 2.0 |
| Jardas perdidas por faltas | 7-56 | 3-25 |
| Turnovers | 0 | 2 |
| PERD | 0 | 2 |
| INT | 0 | 0 |
| Tempo de posse | 18:52 | 17:48 |
Notícias - NCAAF
![]()
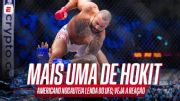
Josh Hokit arrasa Derrick Lewis; Veja a reação da torcida no UFC Casa Branca
UFC Freedom 250 acontece em frente à Casa Branca, residência oficial do Presidente dos EUA
![]()
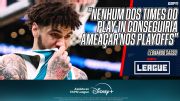
Qual time do play-in pode ir bem nos playoffs da NBA? Veja análise do ESPN League
VEJA a NBA na ESPN e pelo Plano Premium do Disney+
![]()
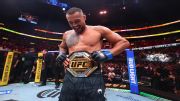
Nocaute com joelho 'estourado', novo cinturão e luta 'surpresa' na Casa Branca; VEJA tudo o que rolou no UFC 327
Próximo UFC numerado será dia 9 de maio, com Chimaev enfrentando Sean Strickland
![]()
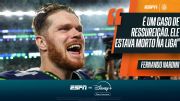
Em exclusiva à ESPN, campeões do Super Bowl pelos Seahawks celebram conquista na NFL e agradecem fãs no Brasil: 'Incrível'
Sam Darnold, quarterback, e Kenneth Walker III, running back, falaram com exclusividade após título contra os Patriots
![]()
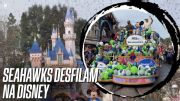
Campeões do Super Bowl LX, estrelas dos Seahawks desfilam na Disney após conquista na NFL; VEJA
Sam Darnold e Kenneth Walker marcaram presença em tradicional passeio após título do Super Bowl
![]()
'Hoje ele é um quarterback que vence Super Bowls': Nardini e Paulo Antunes analisam volta por cima de Sam Darnold na NFL
Veja o League de Passe ESPN no Plano Premium do #DisneyPlus

Classificação Big Ten Conference 2026
| TEAM | CONF | GEN |
|---|---|---|
| Illinois | 0-0 | 0-0 |
| Indiana | 0-0 | 0-0 |
| Iowa | 0-0 | 0-0 |
| Maryland | 0-0 | 0-0 |
| Michigan State | 0-0 | 0-0 |
| Michigan | 0-0 | 0-0 |
| Minnesota | 0-0 | 0-0 |
| Nebraska | 0-0 | 0-0 |
| Northwestern | 0-0 | 0-0 |
| Ohio State | 0-0 | 0-0 |
| Oregon | 0-0 | 0-0 |
| Penn State | 0-0 | 0-0 |
| Purdue | 0-0 | 0-0 |
| Rutgers | 0-0 | 0-0 |
| UCLA | 0-0 | 0-0 |
| USC | 0-0 | 0-0 |
| Washington | 0-0 | 0-0 |
| Wisconsin | 0-0 | 0-0 |
Classificação Atlantic Coast Conference 2026
| TEAM | CONF | GEN |
|---|---|---|
| Boston College | 0-0 | 0-0 |
| California | 0-0 | 0-0 |
| Clemson | 0-0 | 0-0 |
| Duke | 0-0 | 0-0 |
| Florida State | 0-0 | 0-0 |
| Georgia Tech | 0-0 | 0-0 |
| Louisville | 0-0 | 0-0 |
| Miami | 0-0 | 0-0 |
| NC State | 0-0 | 0-0 |
| North Carolina | 0-0 | 0-0 |
| Pittsburgh | 0-0 | 0-0 |
| SMU | 0-0 | 0-0 |
| Stanford | 0-0 | 0-0 |
| Syracuse | 0-0 | 0-0 |
| Virginia | 0-0 | 0-0 |
| Virginia Tech | 0-0 | 0-0 |
| Wake Forest | 0-0 | 0-0 |